Excel’s built-in Python is provided in the form of formulas. Unlike traditional formulas, it supports multi-line Python code programming, offering more powerful functionality. Currently, only Microsoft 365 Excel supports built-in Python, which requires an active internet connection.
Programming Environment for Excel’s Built-in Python
With your computer connected to the internet, open Microsoft 365 Excel. Navigate to the Formulas tab and locate the Python block, as shown in Figure 3-1. The buttons in this block provide support for Excel’s built-in Python.
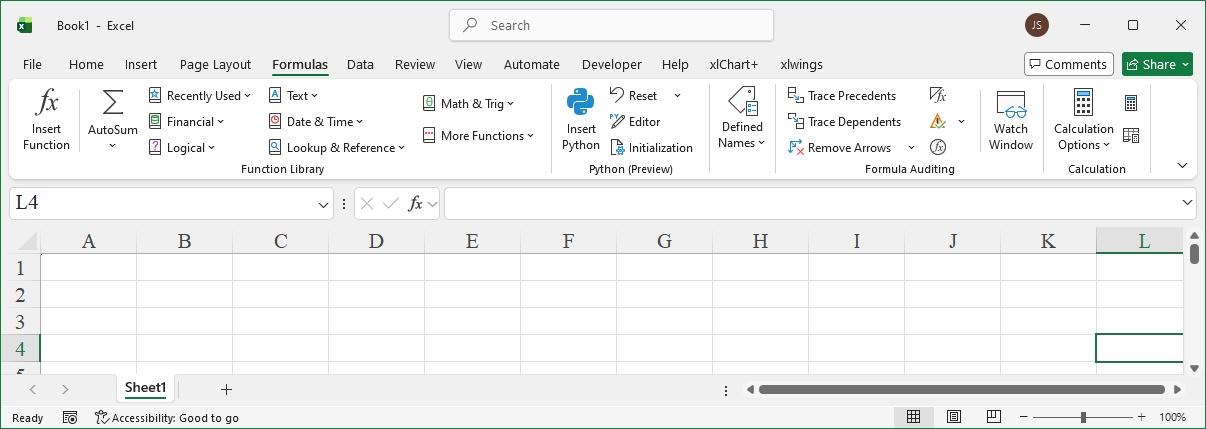
Figure 3-1 The "Python" Block in the "Formulas" Tab
The Python block has 4 main buttons:
Click the cell where you want to use built-in Python, then click Insert Python—the cell enters Python mode (Figure 3-2). You can now enter Python code in the formula bar.
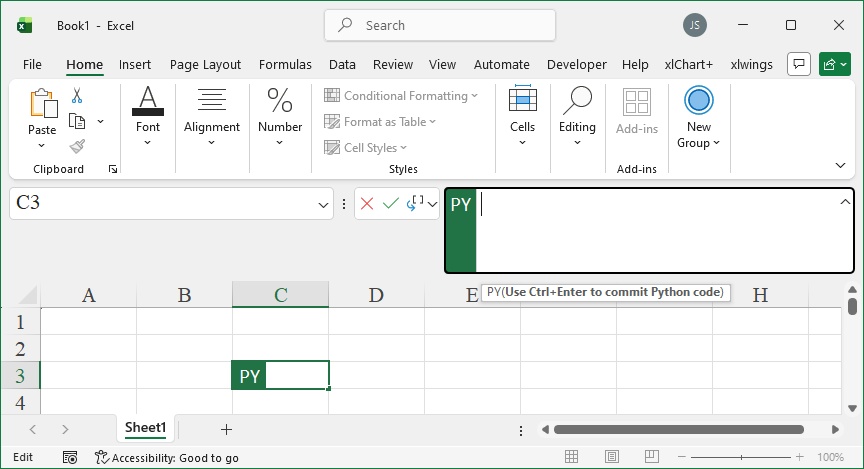
Figure 3-2
Click the triangle arrow next to Insert Python and select Examples from the dropdown menu. A panel with built-in Python examples will pop up on the right side of the worksheet. Click Insert Example for an interesting example to insert a new worksheet displaying the example (Figure 3-3). Studying these examples helps you learn quickly.
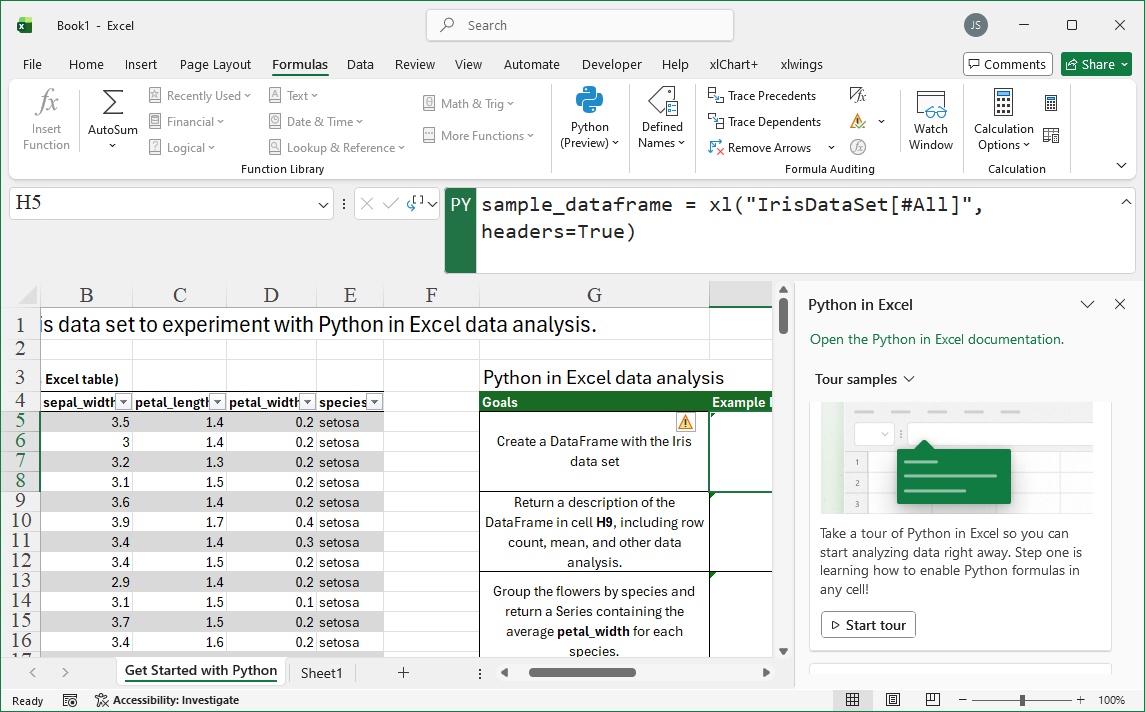
Figure 3-3
Reset: Click this if code execution exceeds 60 seconds to reset the runtime.
Diagnose: Click to view error causes (e.g., type mismatch when adding a null cell value and an integer, as shown in Figure 3-4).
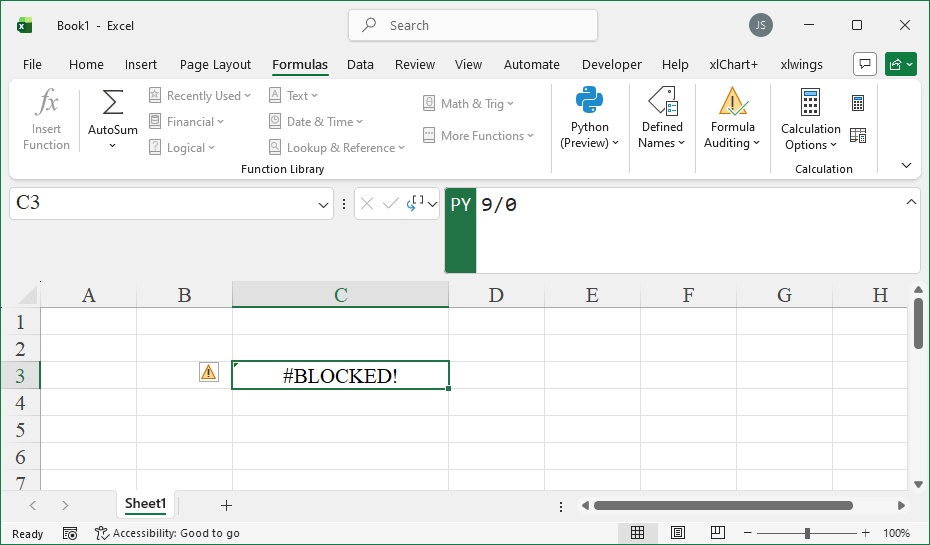
Figure 3-4
Initialize: Shows preloaded import statements for common packages (Matplotlib, NumPy, pandas, Seaborn, statsmodels, etc.). These imports are read-only—customization requires creating a separate first worksheet for your code (executed first in row-major, sheet-order).
The PY Function
Instead of using Insert Python, you can use the PY function to put a cell into Python mode. For example, to use built-in Python in cell B2:
Select cell B2.
Enter =PY( in the formula bar—this activates Python mode.
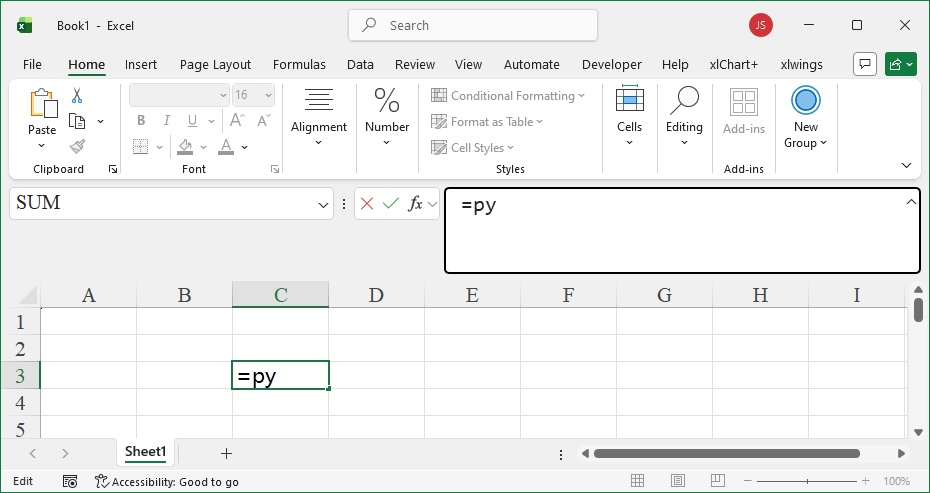
Figure 3-6
All code entered in the formula bar is the first parameter of the PY function. Results are returned as Python objects (default, e.g., DataFrame, Series) or Excel values (toggle via the card icon before the formula bar).
Example: Writing Python Code
Let’s generate a DataFrame and compute descriptive statistics using its describe() method:
In cell B2, enter =PY( to activate Python mode.
Enter the following code in the formula bar:
df = pd.DataFrame([[1,2,3],[4,5,6],[7,8,9]], columns=['A','B','C'])
df.describe()
Press Ctrl+Enter to run the code. Cell B2 returns a DataFrame object—click it to expand and view statistics (count, mean, std, min, quantiles) in the range C3:F10 (Figure 3-7).
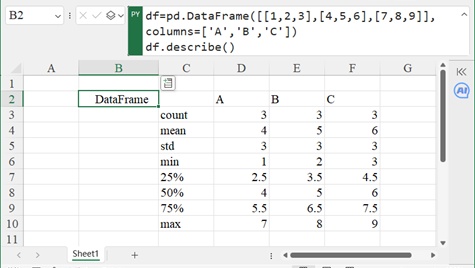
Figure 3-7
Generating Python Code with ChatGPT or Copilot
ChatGPT/Copilot can auto-generate Python code to boost efficiency. Excel’s built-in Python fully supports pandas. Here’s an example of using ChatGPT-generated code for grouped averaging:
Step 1: Prepare the Prompt
Prompt for ChatGPT:
You are a pandas expert. The file path is: D:/Samples/ch03/02 Student Scores by Class.xlsx. The first worksheet’s columns A-C are "Class", "Name", and "Score". Use pandas to import the data (engine: openpyxl), calculate the average score per class (rounded to 1 decimal place), and output results like "Class 1: 88.5". Add comments.
Step 2: Get ChatGPT’s Code
ChatGPT returns:
import pandas as pd
# Read Excel data
df = pd.read_excel('D:/Samples/ch03/02 Student Scores by Class.xlsx', engine='openpyxl')
# Calculate average score per class
average_scores = df.groupby('Class')['Score'].mean().round(1)
# Output results
for index, value in average_scores.items():
    print(f'{index}: {value}')
Step 3: Modify for Excel’s Built-in Python
External Python (e.g., IDLE) can run this code directly, but Excel’s built-in Python requires changes to data input/output (use xl() instead of read_excel(), and output to the worksheet): In cell E2 (Python mode), enter:
df = xl("A1:C26", headers=True)
df.groupby('Class')['Score'].mean().round(1)
Press Ctrl+Enter—cell E2 returns a Series with class averages.